|
|
|
|
|
|
|

clicca l'immagine
per la presentation |
Performance Analysis
Data acquisition is a fundamental means to analyze the
performance, but unfortunately it takes a lot of experience and
a lot of time to really understand things. Not all teams have
the possibility of having a person dedicated to this analysis,
and above all often between one run and another there is no time
to carry out an accurate analysis of the data, for this reason
NT-Project has developed a software that helps to analyze the
performance quickly, allowing you to clearly understand the
differences between one run and another, and consequently
between one set-up and another, to always choose the best
solution. |
|
|
|
|
|
How it works?
|
| Performance is fundamentally
linked to three aspects: |
| tire efficiency |
 |
| chassis efficiency |
 |
| engine efficiency |
 |
|
The efficiency of the tire is evaluated by analyzing the grip that
it is able to provide.
The efficiency of the chassis is evaluated by analyzing how much
grip can be exploited during braking and acceleration, and how the
engine power can be exploited during acceleration.
The efficiency of the engine is evaluated by analyzing the power
that it can develop at full load.
| Our software Performance Analysis uses the data acquired
and the characteristics of the kart to carry out a dynamic
calculation that allows you to evaluate these fundamental
aspects, thus it will be easy to compare the different runs,
and to understand how the set-up differences have influenced
the performance. |
 |
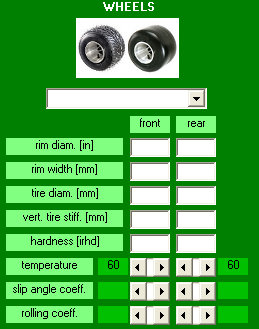
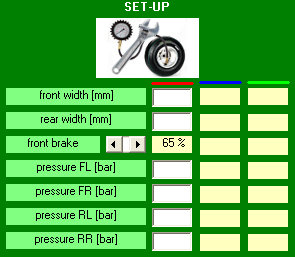
Using the software is extremely simple, in fact it is sufficient to
enter the main data of the kart, the wheels, the set-up and the
weather conditions.
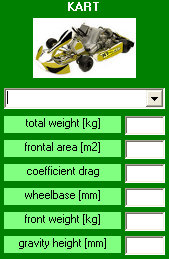
For both the kart and wheel data, the software already
presents a list of the main categories and the most used
tyres, so it will be easy to proceed with the calculation. |
 |
 |
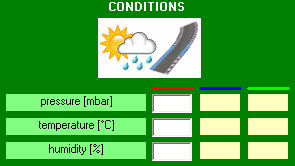
Given that the inflation pressure influences the behavior of
the tire both in terms of slip angle and of rolling
resistance, the software, thanks to a sophisticated model,
takes this factor into account so that the comparisons
between the different runs will be as correct as possible,
the same speech is for the atmospheric conditions which, as
is known, modify the power that the engine can develop. |
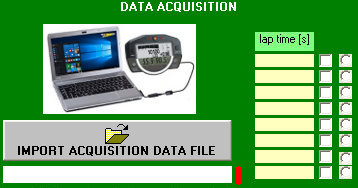
| At this point it will be sufficient to load the
acquisition file of the session that you want to analyze and
to proceed with the calculation |
 |
|
Results |
In few seconds, the software Performance Analysis shows you results
that allow you to quickly analyze your performance.
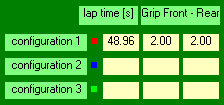 |
At the end of the calculation
the first result that is shown is the maximum grip that was
provided on average by the front and the rear tyres.
Together to this is reported the time of the lap analyzed.
If you compare more runs, the values are reported for each
configuration. |
In addition to this the following graphs are shown:
| FRONT GRIP |
REAR GRIP |
 |
 |
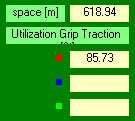
| UTILIZATION GRIP TRACTION |
UTILIZATION GRIP BRAKING |
 |
 |
| UTILIZATION POWER |
POWER |
 |
 |
| |
|
These graphs show the trend of the different quantities at each
point of the track, therefore when comparing different runs it’s
possible to make an analysis point by point of the performance.
In fact, the software allows
you to zoom in on the graphs to analyze in the detail the
quantities at specific points of the track.
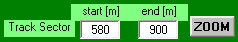
The yellow line highlights the distance traveled from the
finish line to the point where you want to start the
detailed analysis.
 |
 |
| It is also possible to move a
cursor on the graph which allows you to see the value of the
quantity under examination point by point. In case of
comparison of more files the values will be shown for all
the different configurations to be analysed. |
 |
 |
| In addition to the graphs of
the quantities shown for each point of the track, the
software calculates also the power curve provided by the
engine in the specific lap as a function of the rpm. This
power curve is corrected according to the atmospheric
conditions, so if the conditions were very different from
the runs that you’re comparing, you can always have a
realistic comparison of the engine performance.
|
 |
As you have seen, thanks to the software Performance Analysis in a
few seconds you can analyze all the fundamental aspects that
influence performance. Therefore, by comparing the different
sessions you can understand, regardless of the lap time, how the
tires and the engine have performed, and how the chassis has worked,
and this is crucial for making the appropriate set-up choices for
the subsequent sessions.
We invite you to see the full presentation
of the software, where we will also show you a concrete example in
which we will compare the results of different sessions, and this
will allow you to understand even better how thanks to the software
Performance Analysis you will be able to fully exploit your
acquisition data to analyze the set-up choices that you have made,
and to optimize them in the subsequent sessions.
|
|
Purchase |
|
|
|
|
NT-PROJECT - Ferrara (Italy)
- info@ntproject.com |
tutto il
materiale contenuto nel presente sito è coperto dalle leggi sul diritto d'autore ©
2005/19 |
|